This is another blog post which seeks to analyse a viral hashtag, in this instance #ThisIsACoup, with data via Visibrain Focus (via Twitter’s Firehose API which in theory all of the tweets) for the month of July. This particular hashtag is of interest because recently, I received a message from a journalist Paul Mason, economic editor at Channel 4 news asked whether he could use a heat-map I created when the hashtag was trending.
The hashtag organizers have written a statement to why they felt the need to start the hashtag, below is a short extract from their statement:
We decided to support Francesca’s call to launch an online campaign to support the democratic will of the Greek people in the face of extortion by the Eurogroup in its negotiations with Syriza,” the statement continued. “The scandalous Eurogroup proposals yesterday made last night the ideal moment to create a hashtag to express and, above all, coordinate, our outrage at the extortion the Greek government and its people were being subject to.” (quoted in the Guardian Article #ThisIsACoup: how a hashtag born in Barcelona spread across globe).
Twitter, which boasts 316 million monthly active users with 500 million tweets per day, offers a route to raising awareness of world-wide events. In my area of research there are many health campaigns around the world which generate vast amounts of tweets, for example #WorldAutismAwarenessDay, and #WorldSucidePreventionDay, and often these hashtags start to trend, and are visible to other Twitter users.
There is evidence to suggest that social media played a role during the Arab Spring. Increasingly, trending hashtags are reported within the mainstream media, and can drive the news, and reach an even wider audience. This is especially the case with #ThisIsACoup, as the hashtag received wide coverage in the media suggesting it reached a wider audience then just Twitter users. Below are a series of figures that analyse #ThisIsACoup using several different methods:
Figure 1 – Time series graph of #ThisIsACoup (11 July to 17 July)
As the figure above displays, at the peak of the trending hashtag there were 270,391 tweets sent and received by Twitter users. Overall in the month of July there were 604,822 tweets sent and received by 140,794 users, 1,108,729,094 impressions (the number of times users saw the tweets), 158,847 tweets were original (26% of tweets), and 445,975 tweets (74% of tweets) were retweets, indicating that that this hashtag had a high retweet frequency.
Figure 2 – World map of #ThisIsACoup (01 July to 31 July)
The figure above displays the location of users tweeting with the #ThisIsACoup hashtag, where the location information is taken from users who provide a valid country location in their biography. The majority of tweets (24.8%) derived from Greece, the United Kingdom (15%), Spain (10.7%), the United States (9.6%), France (5.8%), Germany (5.4%), Italy (3.6%), Ireland (3.5%) Canada (2.8%), and the Netherlands (2.5%).
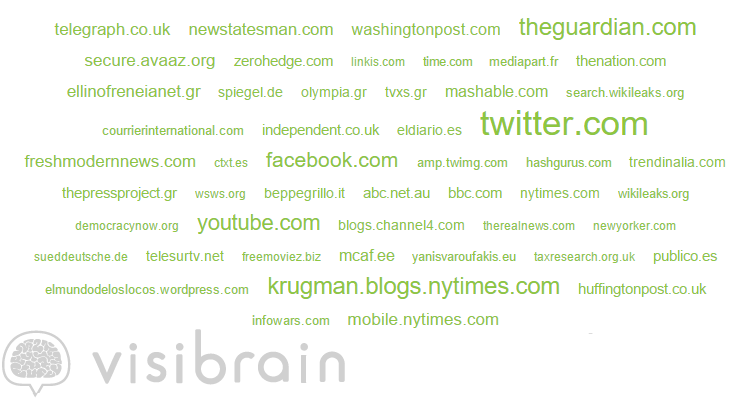
Figure 3 – Top Domains used in #ThisIsACoup (01 July to 31 July)
The figure above displays the top domains linked within users tweets. Twitter, Facebook, YouTube are all among top domains used within tweets indicating that users were linking to these platforms with relevant material. Users were also linking to news stories related to #ThisIsACoup as the Guardian is a top domain, alongside a blog/opinion page by Paul Krugman, whom comments on economics and politics for the New York Times.
Figure 3 – Top hashtags alongside #ThisIsACoup (01 July to 31 July)
The figure above displays the most frequently used hashtags (in the month of July) alongside #ThisIsACoup, were: #greece, #boycottgermany, #grexit, #oxi, #greekment, #greececrisis, and #germany
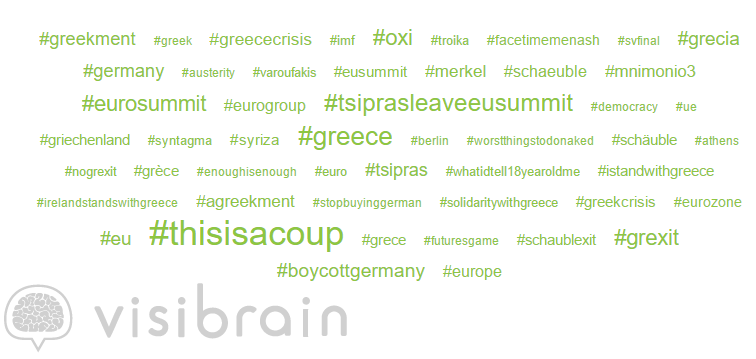
Figure 4 – Top expressions of #ThisIsACoup (01 July to 31 July)
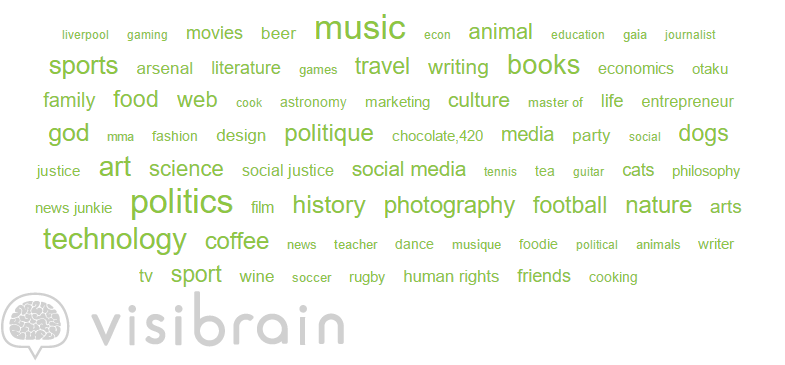
The figure above displays the most frequently occurring expressions as taken from users tweets. The term ThisIsACoup is the most frequently occurring, followed by Greece, Democracy, Europe, and German among others.
Figure 5- Network graph of the first two hours of #ThisIsACoup
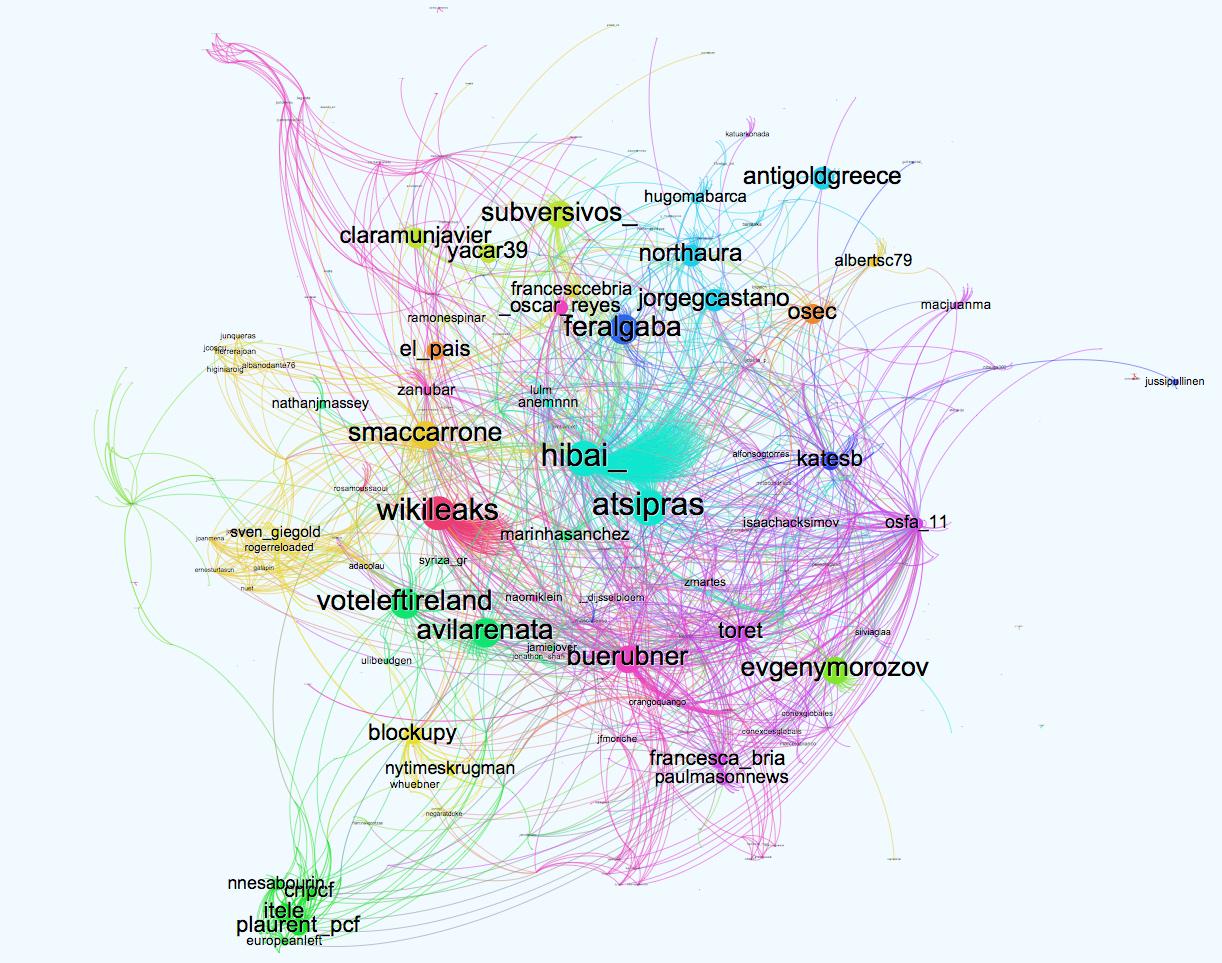
The most influential Twitter users alongside the top tweets in the month of July derived from influential politicians and journalists. The network graph above is of the first two hours of #ThisIsACoup. The atsipras account (center of the graph) belongs to the the current Prime Minster of Greece, and is particularly central in the network graph. The Guardian suggests that the a tweet from Ada Colau drove the hashtag to become viral. However, I would argue that the collective nature of the hashtag i..e, a number of Twitter users all tweeting at once caused the hashtag to become viral. As well as the high retweet percentage (74%) associated with this hashtag, a point that was highlighted in the discussion of Figure 1. Also, check out the NodeXL analysis of the hashtag which I tweeted out when the hashtag was trending.
Acknowledgments
This blog post was a collaborative effort, so there are a few people to thank, (in chronological order):
A massive thank you to Alexandra Boutopoulou, a very talented Masters student whom alerted me to this hashtag back in July, 2015.
A big thanks to Paul Mason, economics editor from Channel 4, for re-invigorating my interest in this hashtag, and for covering the hashtag so well as the events unfolded.
A massive thank you to Visibrain Focus, for providing access to the data via Twitter’s Firehose API, and a shout-out to the lovely Georgina Parsons whom has provided excellent user-support.
A final thank you to John Swain, head of Data Science at Yang Brothers, for creating the network graph in Figure 5.
You can find out more about Visibrain Focus here.


9 thoughts on “An analysis of #ThisIsACoup”